Modeling Complexity | Visual Communication
2024 — present
All work shown was created using Adobe Creative Suite.
As a designer, modeling the complexity of a topic allows you to communicate more easily with your intended audience at any stage in the design process. This section serves a collection of the diagrams, posters, and presentations created over the span of my career.
Sequence: Order over Time
2025 | Diagram Development
Taking a 15 page article that laid out the events of the Deepwater Horizon explosion, I created a single diagram to encompass the engineering attempts to stop the flow of oil that took place over the course of 5+ months.
Final Iteration: In order to promote sequential understanding, images are arranged horizontally to promote sequential understanding. In addition, the first and last illustrations are promoted in position to allow the viewer to compare beginning and end of the attempts. Time is labeled in a non-generic way to orient them to major time periods during the event.
First Iteration: Illustrations are used to explain the different attempts visually. Call-outs are used along the line graph to show the resulting effect on the flow of oil into the Gulf at each attempt, as well as the total amount of oil already there. The major events/hurricanes provided created a separate information zone, which was not effective at visually showing the periods of high vs low activity.
Strategic Grouping
2025 | Diagram Development
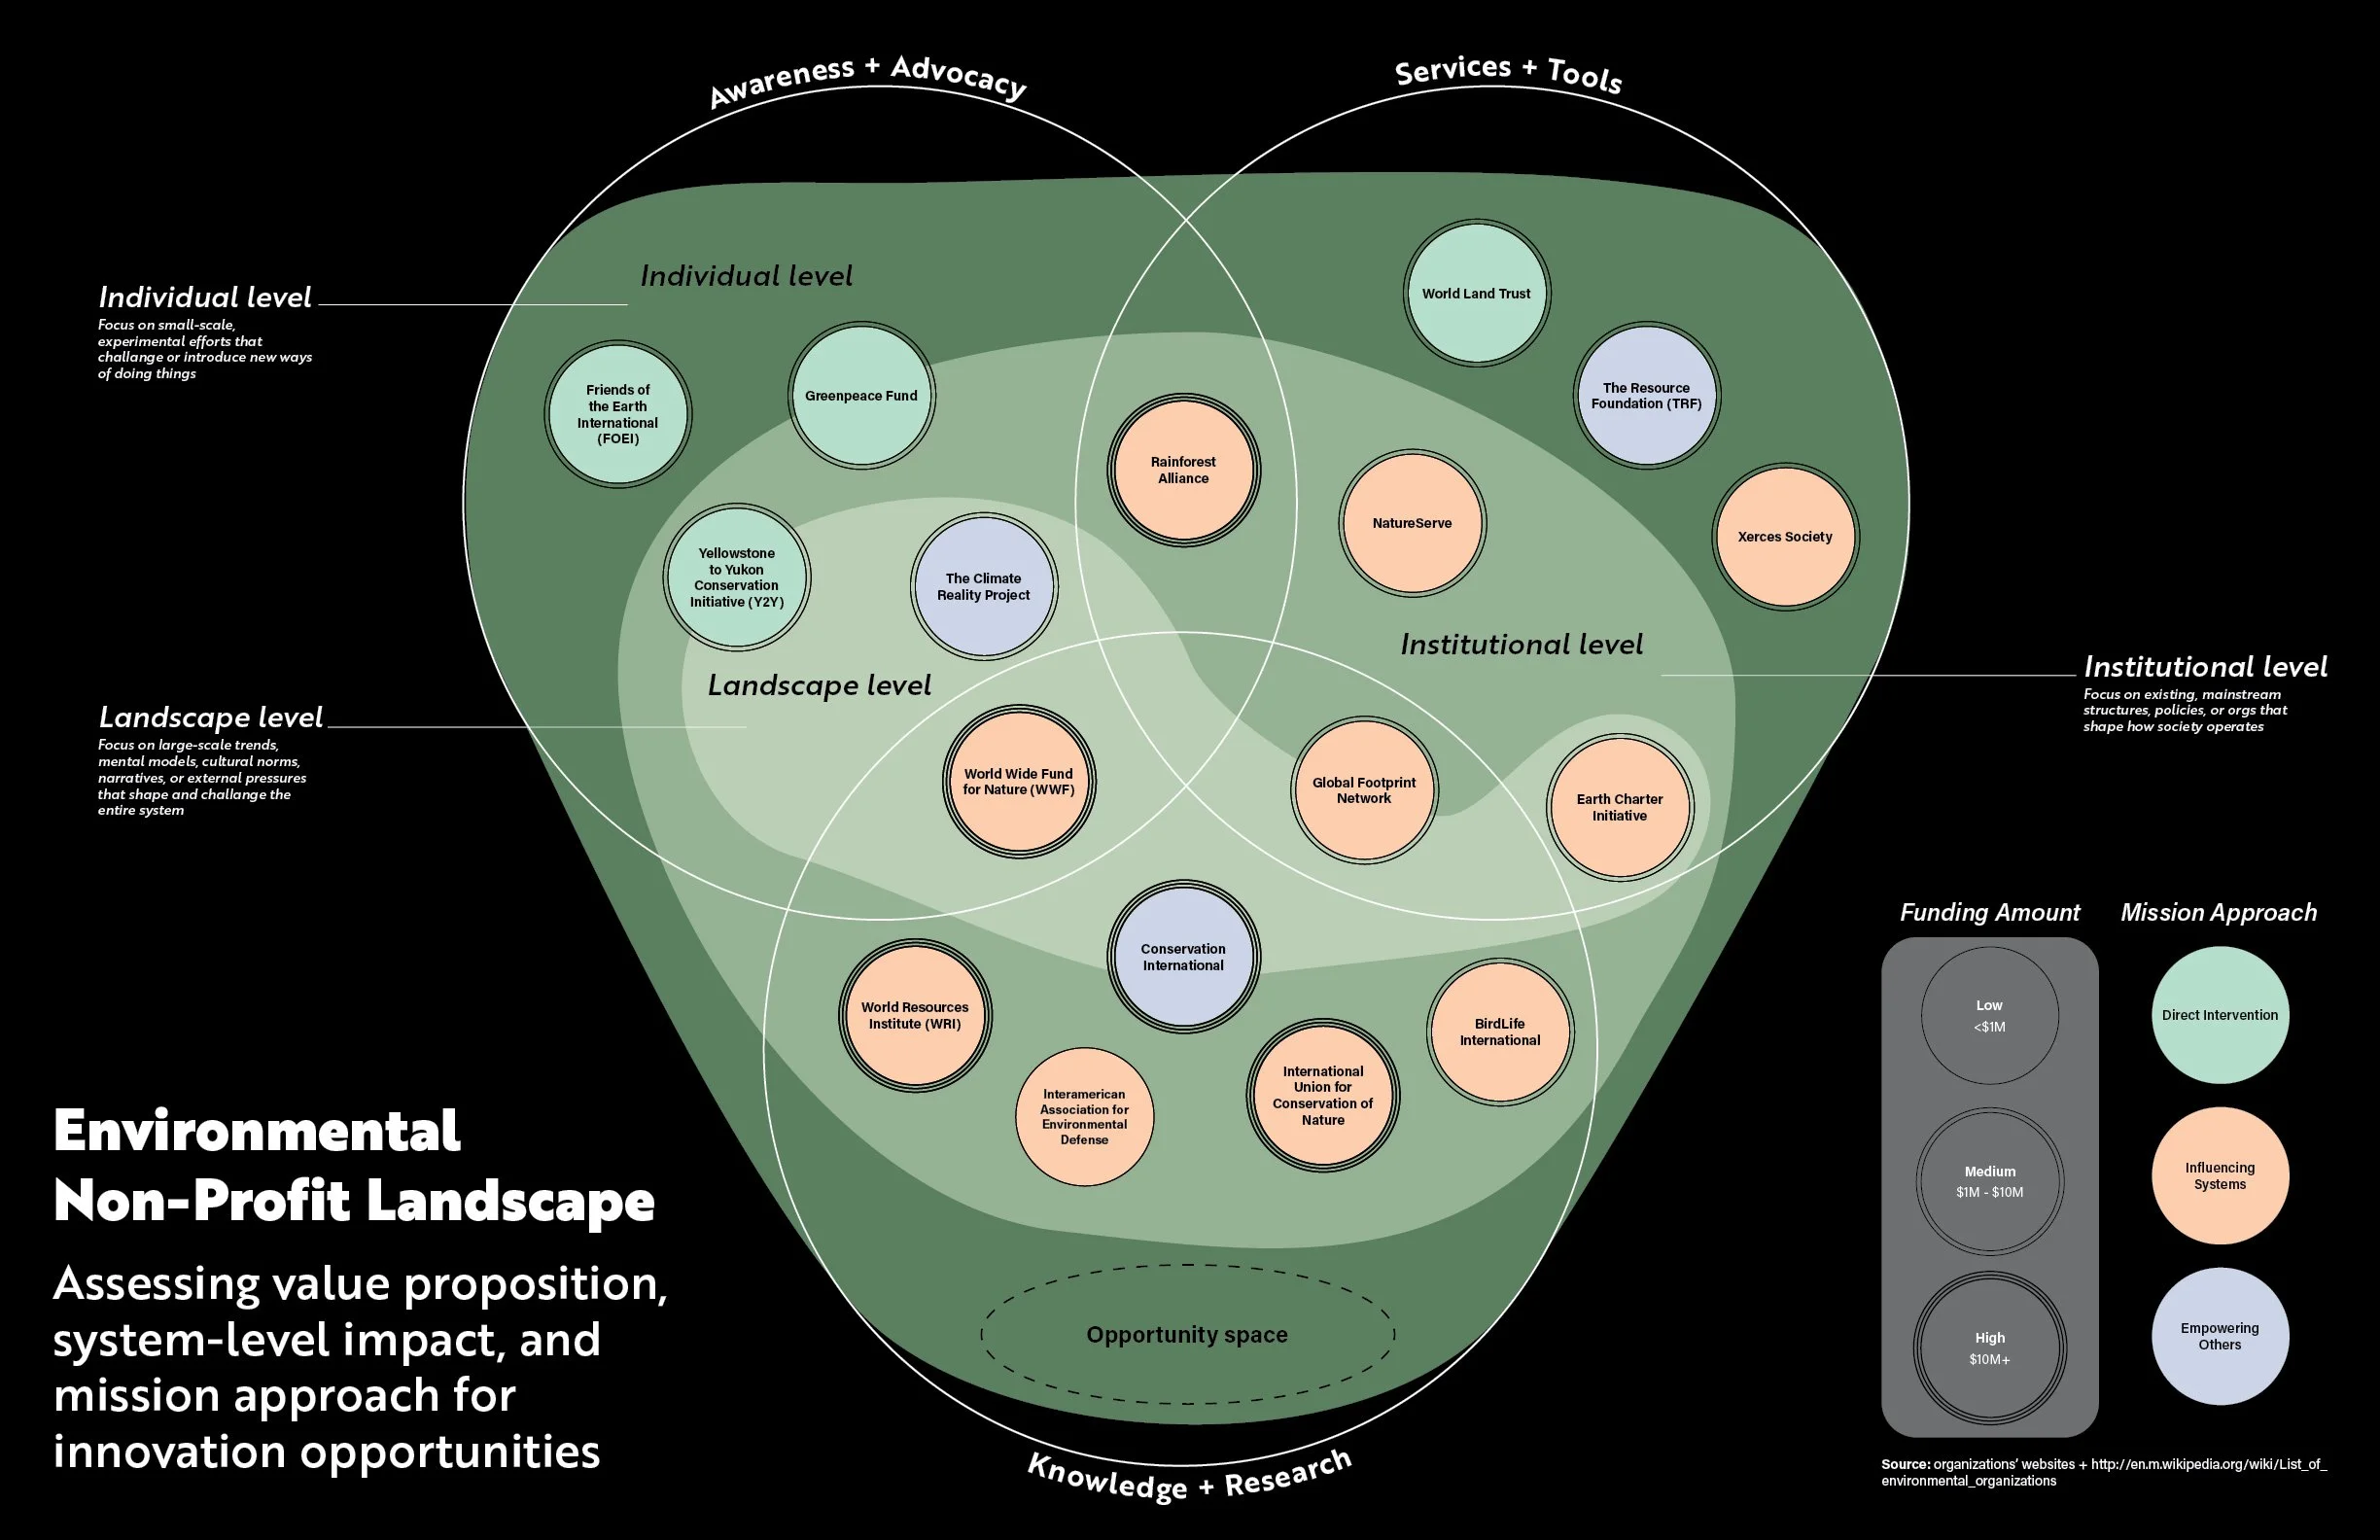
I was tasked with synthesizing new variables based on the names of 17 non-profits, their mission statement, and area of focus. I created 3 new variables — mission approach, value proposition, and system-level impact — that would allow me to visualize the current environmental non-profit landscape, highlighting how established organizations position themselves and where gaps for innovation exist.
Final Iteration: Call-outs for each system level clarify activities undertaken there and allow the diagram to stand on its own. Density of stroke was used to show differences in funding to allow for easier attentive viewing.
First Iteration: The layered grouping approach integrates multiple strategic variables to provide a comprehensive view. The Venn diagram establishes value proposition categories, while the system-level heat map overlays organizational impact.


